%20(Website).png?width=1366&height=768&name=LAMBDA%20LEARNING%20LOGO%201(%20px)%20(Website).png "LAMBDA LEARNING LOGO 1( px) (Website)")


|
Take this entire guide with you! Download The Essential Guide to Learning Analytics in the Age of Big Data and keep it as your eLearning secret weapon! |
Introduction
This article is designed to be your A-to-Z guide to learning analytics. Use this as a valuable resource to successfully initiate a learning analytics approach within your company. You’ll discover:
- The basic concepts of learning analytics
- How to use learning analytics for evaluation
- What metrics and sources to use in implementing learning analytics
- How to turn learning analytics into actionable outcomes and improved course design
- How to implement learning analytics in your organization
- How to address the ethical challenges of learning analytics
You’ll find the information below helpful to you and all of the stakeholders within your organization. So let’s begin by exploring why learning analytics is an important component of instructional design! (As a refresher, here is an article on What is Learning Analytics?)
CONTENTS
- The Dawn of Big Data
- Using Big Data to Analyze Learning
- The Importance of Learning Analytics for Instructional Design
- Evaluating Learning Analytics and Measuring ROI
- Sources of Data You Should Be Collecting
- Data Points to Prove the ROI of Learning Analytics
- How to Turn Learning Analytics Into Actionable Outcomes
- How Predictive Learning Analytics Reduces Ineffective Job Training
- Improving Online Course Design
- 7 Steps to Successfully Implementing Learning Analytics in Your Organization
- Ethical Implications of Learning Analytics
- Additional How-to Resources
1. The Dawn of Big Data
The widespread adoption of digital technology has created an explosion of data. In fact, every time you use digital technology, you’re leaving a digital footprint of your activity. And in recent years, it has become possible to collect, aggregate, analyze, categorize, and learn from all of this data.
This was the dawn of big data, and it made possible the ability to learn from the behaviours of people using digital technology. Companies collect and analyze big data for a wide range of purposes—everything from feeding the hungry to preventing crime to optimizing marketing campaigns.
Most of the time, companies collect big data from external sources to help the business serve customers more effectively, become more efficient, and increase profits. Of course, data isn’t meaningful unless you can analyze it. This is done by creating models based on the data, then running tests to observe the results. Analysts look for patterns and insights to help solve a problem. Tweaks are made, and more tests are run, until the results match the goals.

2. Using Big Data to Analyze Learning
Before the rise of big data, instructors had to rely on periodic tests and assessments to judge the progress of their learners. Often, struggling learners were identified too late, and the work to catch up would often require enormous effort.
But as big data began to spread into every type of industry, chief learning officers realized the opportunities for improving learning experiences. If we could understand learners’ behaviours and activities, and find correlations to their learning success or failure, we could help people become more successful in their online courses.
This use of big data to improve online learning is called learning analytics. This is how learning analytics works within the context of your organizational learning management system (LMS):
- Learning management systems, like Moodle and Totara, collect a vast amount of user data. Every time a user interacts with a learning module, forum, assessment, or communication tool, the LMS records, and stores that information.
- This data can be sorted, filtered, and correlated to specific metrics, such as activity and course completions.
- As patterns emerge, facilitators and course designers can make adjustments to the course that will help struggling learners to become more successful. For example, there may be a specific set of behaviours that act as an early warning sign that a learner will fail. If a learner exhibits these behaviours, the instructor can be alerted to reach out to the learner and intervene.
Research shows that learners recall more when they’re more engaged with the course material. Learning Analytics makes that possible by tracking users’ activity to understand where they are most and least engaged with the module. It then becomes possible to create personalized eLearning courses that break out of the one-size-fits-all paradigm.
This use of big data and data analytics in an eLearning environment creates a feedback system that can help instructors and course designers to discover solutions to the most common problems in online learning.
Watch and Learn even more with our video on Analyzing lesson activity data to build better eLearning!

3. The Importance of Learning Analytics for Instructional Design
Every time a learner interacts with your learning management system (LMS), another piece of data is created and collected. Every button click is tracked and recorded. Many instructional designers don’t take full advantage of this data—but with learning analytics, you can use that data in powerful ways to impact not only your course design but much more.
Instructional designers and course developers use analytics as a source of feedback, which they can use to tweak their courses. Most instructors leverage learning analytics for activities like the following:
- Monitoring learner progress
- Exploring learner data
- Spotting problems and discovering patterns
- Finding early indicators for success or failure
- Assessing the usefulness of learning materials
- Intervening and helping struggling learners
- Improving their course design
But the importance of learning analytics in instructional design goes far beyond tactical module improvements. Learning analytics provides some enormous benefits to learners, course design, and the organization itself. Let’s explore that impact.
We’ve got even more on the best practices for course design, which you can find in this video on the Using Analytics to Deliver Engaging Courses.
Impact on Learners
Learning data captures everything a learner does online, making it possible to create “smart” algorithms that can sense when a learner is struggling, based on their behaviour. It’s even possible to make early predictions about long-term outcomes. Models that use learning analytics can:
- Identify if a learner is disengaged with the course material
- Predict learner achievement
- Understand how particular learners use different learning resources
Many LMSs can use this learning analytics data to create personalized learning experiences that are customized for each learner, based on their behaviours and performance results. Online courses can be personalized in a couple of ways:
- Providing options that let learners tailor their learning experience to their preferences. For example, some systems allow learners to choose the next topic to work on, or to pick the type of learning activity they like best (i.e. video instruction, reading instruction, practice, self-test).
- Adapting to the learner’s needs based on their performance. This is more common. Typically, it involves assessing the learner’s competence or mastery and providing the appropriate level of learning content— such as prerequisite material or advanced subject matter—depending on the learner’s readiness.
Some researchers believe that learning analytics can be used to identify learners who are at risk of becoming disengaged, failing, or dropping out of the course. LMSs can track key indicators, such as forum participation and completed assessments, to calculate a risk score. Analytics and reporting tools, such as Lambda Analytics “Zoola”, can alert instructors of learners that may be headed for failure or dropout. This gives instructors the chance to provide extra help and increase retention.
Take this entire guide with you! Download The Essential Guide to Learning Analytics in the Age of Big Data and keep it as your eLearning secret weapon!
Impact on Course Design
Learning analytics uses a wide range of data about learners and their behaviours. You can use this data to help design the best learning environment and experience for your learners. There is tremendous potential in the mountains of data that’s collected to better understand how learners learn.
So far, most of the research has focused on developing models for predicting success and retention. However, by analyzing learners’ behaviours online, it’s possible to get a better understanding of what environments and experiences are best suited for learning.
There’s a push to discover a generalized model for predicting learner success. But some research suggests that the differences between contexts and courses play a major role in effectively predicting whether learners will pass or fail. Learning analytics can make it possible to understand the contextual variables from course to course, and help instructional designers develop learning modules that take those factors into account.
This provides great potential for understanding and optimizing the learning process. By tracking learners’ interactions with the LMS, instructors can pinpoint the most effective techniques to enhance their courses accordingly and identify the success of their pedagogies.
Gathering more complete data on the learner experience can also help your company to spot areas of improvement that learners are concerned about—for example, inadequate feedback. These interventions can help instructors build a better course that serves learners’ needs better.

Impact on the Organization
As improved course designs impact learners’ success, you can begin to leverage learning analytics to track the impact on your company’s operational efficiency.
The Kirkpatrick Evaluation Model and the related Phillips’ Model (see the next chapter) were developed to evaluate the effectiveness of online learning based on the impact it has on your organization. But the challenge for many companies is being able to isolate online learning from all the other factors in your company—factors like process improvements, new productivity apps, or culture change.
While it’s impossible to completely isolate the effectiveness of online learning from all other factors in your organization, you can take a broad systems approach and use learning analytics as one of many factors that measure the overall effectiveness of your training and development program.
Learning analytics can have another, indirect impact on your organization, as well. For some companies, learning analytics has a ripple effect throughout the business. As instructional designers increasingly use learning analytics to make better decisions about their course design, other areas of your organization may see the benefits of data-driven decision making. Before long, they may begin to adopt the practice in their own spheres—increasing the overall efficiency of your company.
Discover exactly How To Utilize Data To Improve Operational and Learning Effectiveness with this video crafted to save you time and effort improving your eLearning!
4. Evaluating Learning Analytics and Measuring ROI
The Kirkpatrick Evaluation Model is the gold standard for assessing online training programs. The Kirkpatrick Model was developed to help trainers measure the effectiveness of their training objectively. It’s the most recognized method of evaluating a training program’s ROI.
The Kirkpatrick Evaluation Model
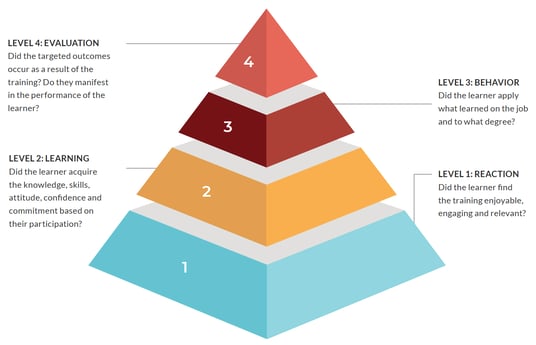
Developed by Donald Kirkpatrick in 1959, the Kirkpatrick Model has seen several updates and revisions. It identifies four levels of learning, with each level building on the one before it.
|
Level 1: Reaction |
How much do participants find the training favourable, engaging and relevant to their jobs? This includes the learner’s satisfaction with the training, their active engagement with learning exercises, and the perceived relevance to their actual work. |
|
Level 2: Learning |
To what degree do participants acquire the knowledge, skills, attitude, confidence, and commitment based on their participation in the training? Level 2 is measured by learners’ acquisition of:
|
|
Level 3: Behaviour |
To what degree do participants apply the training once they are back on the job? This measures the processes and systems that reinforce and reward performing core behaviours on the job. |
|
Level 4: Results |
How well do targeted outcomes occur as a result of the training and the support and accountability package? Level 4 is measured by indications that core behaviours are on the right track for creating positive impact. |
Using an evaluation model like the Kirkpatrick Model can help you objectively analyze the effectiveness and impact of your online training program. As you gather more data from each level, you can see where your learning modules are performing strongest, and identify opportunities for improvement.
For example, if you’re seeing a drop-off in effectiveness between Level 2 and Level 3, you’ll know that your learners are learning the material well, but they’re having trouble applying it to their job roles. This gives you some direction for investigating the disconnect and modifying your course design as needed.
Grab your copy of The Practical Guide to Evaluating Your Workplace Learning Effectiveness Part 1: How Training Program Evaluation Is Hurting Your Talent Development to avoid the biggest (and most common) pitfalls that undercut your L&D initiatives.
Adding ROI to Kirkpatrick
The Kirkpatrick Model is important, but the model itself doesn’t provide the means to measure the four levels. Without a measurement process in place to evaluate learning effectiveness, the model isn’t very practical.
Jack Phillips made a major contribution to the field of learning measurement by developing a process to measure Kirkpatrick’s four levels. And perhaps just as significant, he added a fifth level—Return on Investment (ROI).
Phillips’ Model makes it possible to collect Level 3 and 4 data and determine the impact of training itself on job performance. With the Phillips Model, you can isolate the impact of online training, versus other factors, at Kirkpatrick’s Level 4. From there, it’s possible to calculate ROI by converting impact into monetary value and comparing it to the cost of your online courses.
 Maximizing ROI on Your Training Investment
Training is a critical part of the success of any organization. The problem is, determining actual ROI on the effectiveness of training is a perennial question mark.
To calculate the ROI of your training, you’ll need to measure organizational results. That means selecting the right metrics on actual job performance data—not just training performance. And the data should be able to demonstrate that the training is responsible for increasing revenue or decreasing costs.
For example, senior living centres rely heavily on proper training to both reduce costs and increase revenue. Nurses are trained in workplace safety, preventing patient falls, and administrative procedures. Avoiding accidents and improving administrative efficiency cuts costs (including lawsuits!) for the organization. At the same time, staff are also trained to care for residents’ families, which can have an indirect impact on increasing revenue—referrals are a major source of new business for nursing facilities.
So, how do you identify if training is impacting your bottom line? To accurately measure the effectiveness of your training program, you’ll need tools that can help you answer the following questions:
|
If budget and ROI are your main concerns, this article focuses on How To Get The Most From eLearning While Increasing ROI.
The Gap in Evaluating Learning and Performance
It’s imperative that organizations fully understand the ROI of their training programs because ultimately their goal is to increase revenue and cut costs. If training courses aren’t achieving their outcomes, they’re negatively impacting the business.
Most learning management systems can automatically track and report data at Kirkpatrick’s Level 1 and Level 2. Assessment tools can capture learners’ reactions to the course, and templates can create reports (Level 1). Training programs can also easily administer pre and post-tests that evaluate learning results (Level 2).
The LMS alone is unable to furnish a full picture of learner performance for which the courseware is intended and in assessing the learner’s ability to apply the training (Level 3) or judging whether the targeted outcomes are achieved (Level 4), Lambda Solutions’ Zoola Analytics can bridge the gaps. Zoola helps overcome the limitations in LMS reporting and analytics by addressing several challenges:
- Limited access to data
- Limited capabilities to analyze data
- Limited options to present data
- Time spent creating reports
- Limited ability to demonstrate the business value of learning
Tools such as Lambda Analytics “Zoola” helps organizations make sense of their learning data quickly and easily, by providing deeper insight into the performance of learners, and learning programs — including how long learners are spending in courses, where learners are struggling or excelling, and how effectively they can apply what they’ve learned. Zoola lets you generate and share real, actionable insights in just minutes.
Need to find and close skill gaps as soon as possible? We’ve got you covered with this step-by-step article covering the 7 Steps for Successfully Implementing a Skill Gap analysis with Learning Analytics.

Closing the Gap in Course Evaluation
The data you need to bridge the gap between training and performance most likely already exists in your company. Individual performance data exists in performance management systems. Organizational data exists in marketing, sales, and financial systems.
Bridging this gap requires a technical infrastructure that minimizes the administrative effort needed to collect and analyze the training and performance data together. While most learning management systems don’t bridge the gap, some advanced analytics tools, such as Zoola, provide the connection that your organization needs for proving ROI.
But what are the best sources to collect the data from?
5. Sources of Data You Should Be Collecting
If you haven’t used learning analytics before, you might be wondering what data is the right data to be monitoring. What are the best sources of learning analytics in your LMS, and how do you figure out which ones to use?
With the enormous amount of data that’s available, it’s easy to get overwhelmed by the prospect of using learning analytics. But if you start small, you can establish a foundation to build upon as you become more familiar with the learning analytics data that’s available.
The key is to start with the right learning analytics data. In this chapter, we’ll give you the top sources of learning analytics—and help you think about which ones make sense for you.
Why Are You Collecting Learning Analytics Data?
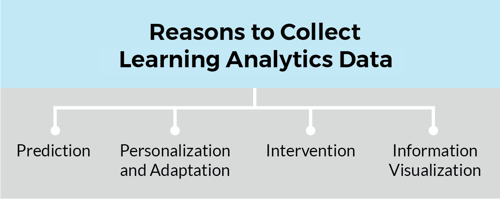
There are many reasons to collect data for learning analytics. Organizations use learning analytics for a wide range of purposes, including:
- Prediction—To identify learners at risk of dropout or course failure
- Personalization and adaptation—To give learners customized learning pathways, or assessment materials
- Intervention—Providing instructors with information to support learners
- Information visualization—Learning dashboards that visually display overview learning data
Before you begin analyzing your data, you should understand what you’re collecting, and why you’re collecting it. Just as your courses have specific objectives and outcomes, your data collection should, as well.
If you try collecting all the data you can find and then try to sort it out later, you’ll only create headaches for yourself—and probably end up paralyzed by the chaos. But a strategic, goal-oriented approach will guide your choices of data sources and help keep your efforts easy to manage.
In general, learning analytics helps you understand the effectiveness of your learning modules at three levels. You will need to consider which of these levels you’re seeking to understand before you select the data to use:
- Learner impact. Personal performance in relation to learning goals, learning resources, and study habits of other classmates.
- Course impact. This includes data such as social networks, conceptual development, discourse analysis, and “intelligent curriculum.”
- Organizational impact. Predictive modelling and finding patterns of success and failure
You can use learning analytics to understand the success of your online learning programs at each of these levels. Fleshed out, your desired outcomes might be to answer questions like these:
|
Understand your goals, and map your goals to the type of data available. The data you analyze will be determined by the outcome you want to achieve. And avoid the shiny-object syndrome—don’t collect data you aren’t going to use.
Get your analytical reporting off to a running start by understanding in this article on The Most Beneficial Learning Metrics for eLearning and Why You Should Track Them

Top 3 Sources of Learning Analytics
Once you understand why you’re collecting data, you’ll be able to select the most appropriate data sources. Depending on your goals, your most valuable data will be gathered from one or a combination of the following contexts.
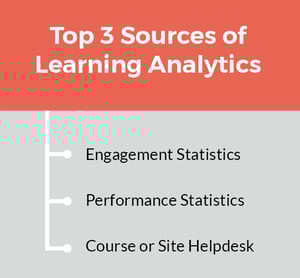
1. Engagement Statistics
Engagement-related statistics can help you assess learner engagement with the module. If you need to measure the success of a learning initiative based on usership, this is a great place to start. Look at these sources for engagement insights:
- Site statistics and logs, location/IP; quiz/course activity statistics (question assessment)
- Logins
- Course access
- Time spent learning
- Session – session metrics, tools and content accessed, frequency
- Learner origin of access – home, office, etc.
2. Performance Statistics
These statistics are performance-related. They can help you assess the quality of your courses and the effectiveness of your training modules. You won’t need all of them in your assessments. Only use the data that will be most valuable to achieving your objective—what it is that you want to understand.
- Participation in discussions
- Participation in the course
- Gradebook scores – quizzes, exams, homework submissions
- Self-assessments (graded and non-graded)
- Journals
- Other course activities – webinars, classroom, collaborative exercises
- Use of resources (video, PDF, etc.)
- Course progress
- Leaderboard
- Frequency of access – how often a resource or activity is accessed and how long
- Online learner feedback—on the course, the instructor, etc.
3. Course or Site Helpdesk
While this data is external to your LMS, it can be valuable. Helpdesk data tends to be fairly rudimentary, but it can be an important source of information for assessing patterns and frequently-asked questions or issues.
|
Examples of Learning Analytics in Action Imagine that you want to identify individual areas for course improvement. Statistics related to online learner performance, learner feedback, and completion rates would help you spot the issue. Look for trends that might imply weaknesses in the course design—maybe particular assignments or course components that have a large number of incompletes. For example, perhaps learners are consistently failing a quiz because they are skipping a specific content resource—a video, a PDF, or a lesson. You can address the issue by restricting access to the quiz until the learner has read the content. If you want to get a sense of your learners’ learning experience in the course, collect student evaluations that ask about the eLearning activities, the course, and even the instructor. To determine if the training modules are successfully affecting on-the-job performance, use LMS metrics that assess theory-to-practice application. You can also track interactive assessment results from simulations. |
Want to dive into the deep end of big data? Grab your free copy of LMS 101: Learning Analytics!
Making Learning Analytics Manageable
Learning analytics gets a lot of press in the instructional design world, but it’s rare to hear much about which learning analytics sources are the best ones to collect. Taking a strategic approach can help make an enormous task manageable. Understand your goals, map your goals to the type of data available, and collect only the data you need. For example, one goal might be to increase completion of the inventory management course for order fulfillment personnel by 20%—from 62% to 74%—by the end of Q2. A report will measure it and the tactics used to increase completion.
Start small, and before long you’ll start getting a better understanding of the effectiveness of your online learning programs. Next, we’ll show you how to collect data to prove the ROI of your learning analytics efforts.
Keeping your analytical reporting lean is easier said than done, but this video from our Learning Analytics experts will save you a ton of time and effort with these Top 5 Tips for Keeping Reporting Simple.

6. Data Points to Prove the ROI of Learning Analytics
Your organization’s executives have invested into your LMS, and they’ll want to know that the cost was worth it. Even if your LMS was free, there were internal costs. You’ll also be asking for additional eLearning budget allocations in the future, so you’ll need to justify your past and current initiatives by showing a return on investment.
But where do you start? Many instructional designers report on activity measures—numbers of learners, completion rates, etc. While these metrics can be used to show successful course adoption, ultimately you’ll need more than that to show ROI that impacts the bottom line. Quality and impact matter more than the number of learners or quantity of training sessions. You’ll need to provide performance measures as well as activity measures.
Activity Measures Vs. Performance Measures
Activity measures are related to learners’ participation in a module. They provide statistical information about the use of the course and its success, in terms of participation. LMS administrators and course instructors need a meaningful analysis of module activities. These metrics help to evaluate the success of implementation and participation, and to measure the effectiveness and impact of learning programs.
|
Examples of activity measures include:
Performance measures, on the other hand, tell you how well you have trained from a business-case perspective. Examples of performance metrics include:
|
Download a Copy of The Essential Guide to Learning Analytics in the Age of Big Data and keep it as your eLearning secret weapon!
Reporting Training Activity and Performance Measures
Activity measures are generally easier to collect than performance measures, because they are primarily data associated with the training enrolment process. Because training needs to be coordinated and scheduled, the information is readily available within the LMS. Most learning management systems can easily export this data, although it’s debatable how well they report the information for useful analysis.
Most organizations do a decent job of reporting the activity measures that are easy to collect, such as number of courses run, or number of people trained. But performance measures are more difficult to obtain.
Some feel that certain performance measures are nearly impossible to obtain—although satisfaction-related measures such as instructor performance or course-ware quality can easily be collected through end-of-course evaluations. It’s also fairly simple to obtain knowledge transfer measures by collecting pre- and post-test scores—but the testing exercise can be a significant drain on a company’s resources.
Return on investment is the brass ring of testing measures. Although ROI is a powerful metric, for many training groups it’s nothing more than a distant dream. The reasons abound, but often it’s because learning data and performance data often reside in different systems, making this type of comparison challenging. Other times, learning goals aren’t well-defined, or they aren’t aligned closely with the company’s business goals. And many organizations simply don’t track the right data, so the metrics to prove ROI aren’t being captured.
Nonetheless, performance measures are critical. If you don’t know which programs have the greatest impact on job performance and business goals, your measurement system has some significant shortcomings!
Performance Metrics Needed
Businesses are constantly looking for better ways to run lean. As a result, training departments can’t rely purely on activity measures to justify their budgets. Executives aren’t interested in the number of participants or how many modules were run in a quarter—they need to know what kind of impact training has on the company’s bottom line.
Your company’s CEO is constantly trying to control spending and costs, and your CLO (Chief Learning Officer) is asking for a budget increase for the next fiscal year. If your budget is to be approved, you’ll need to show some evidence to not only justify the increase, but possibly to show the ROI on the current program in order to avoid budget cuts. Tools that help your company perform better, retain employees, and improve the bottom line are solid investments that prove their value.
If you’re reporting that 70% of the company received training in the prior year in a total of 250 courses, and everyone you talked to enjoyed the training—you can expect to lose your budget request.
Your CEO won’t be compelled to approve a training budget based on activity metrics alone, no matter how quantitative the data is. While activity metrics are valuable, they don’t reflect the impact on your company’s business goals.
Your data needs to answer questions like these:
|
Implementing Performance Measurement
Most organizations that follow the Kirkpatrick Model can’t evaluate their program beyond its first two levels.
The learning management systems that many organizations use make lower-level evaluations easy, but they don’t provide any mechanism for higher-level evaluation.
Most learning management systems will automatically track and report information required for Level One and Level Two analyses. They include assessment tools that can capture each learner’s reaction to the course and templates that can create reports. For online and blended learning, the Level One assessment (the learner’s reaction) can be completely integral to the course. Likewise, training programs can inexpensively and easily administer pre- and post-tests that evaluate learning results (Level Two).
Grab your copy of The Practical Guide to Evaluating Your Workplace Learning Effectiveness Part 1: How Training Program Evaluation Is Hurting Your Talent Development to avoid the biggest (and most common) pitfalls that undercut your L&D initiatives.
More Powerful Performance Reporting
To successfully manage performance metrics and evaluate ROI of the training, you’ll need to have the right technical infrastructure and a good model of learning improvement. You’ll also need some expertise in:
- Data management and warehousing
- A variety of systems and databases
- Analytics
- Web-based application development
Here again, Zoola Analytics closes the gap between your training and its impact on individual performance and organizational performance. Zoola makes it faster to perform the analysis and build reports. You can dig deeper into learner data, generate full insights into learning programs, and generate configurable, exportable reports quickly.
For Moodle and Totara Learn LMS administrators, Zoola eliminates hours of effort to report on eLearning usage and outcomes, such as course activity, progress, effectiveness, and more.
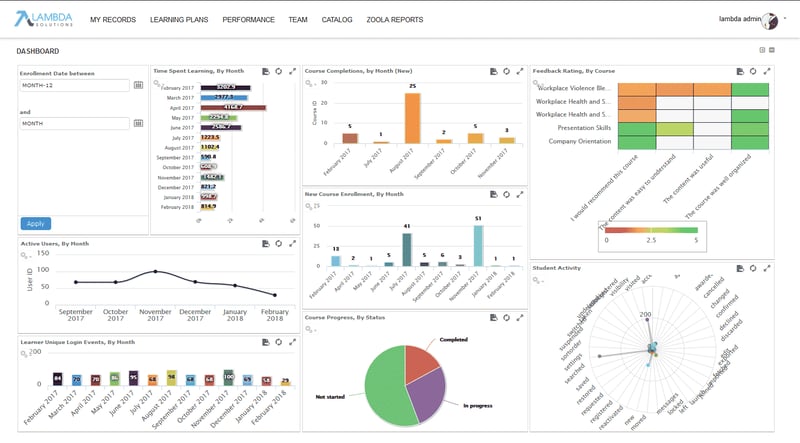
Screenshot of Lambda Analytics "Zoola Analytics" dashboard reporting.
But collecting and analyzing data is only half the job. We must actually improve the eLearning experience. We’ll explore that next.
7. How to Turn Learning Analytics Into Actionable Outcomes
Learning analytics doesn’t provide any value if the analysis doesn’t lead to actionable outcomes. Some companies that use learning analytics get off to a strong start with learning analytics, but they forget to close the loop— they collect and analyze data, but they stop there.
Effective learning analytics is a cyclical process. Learners generate data that can be analyzed for patterns such as successes, weaknesses, overall personal or comparable performance, and habits. Instructors can administer “interventions” based on the information gathered, and the process then repeats itself. As learners respond to the interventions, new data reveals their progress and instructors continue to adapt their instruction to help learners succeed.
- When is a learner at risk of failing or dropping out?
- Identify gaps in courseware
- Determine intervention strategies based on analytical data
- Does a learner need extra support on a specific area?
Actionable Learning Analytics
But actionable learning analytics doesn’t just answer these questions— it helps instructors to choose the right interventions. Intuition plays an important role, but learning analytics is an integral tool for helping struggling learners achieve their goals.
There are four types of analytics that go into developing actionable learning analytics. All four are integral in helping instructors understand how to help learners succeed:
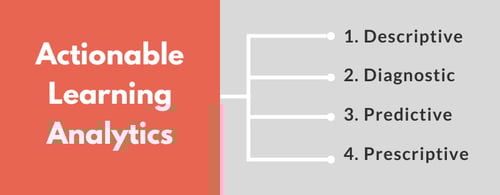
- Descriptive—What happened? Descriptive analytics takes learner data and creates dashboards that display meaningful patterns and trends.
- Diagnostic—Why did it happen? Diagnostic analytics seeks to understand the reason for trends and outliers in the data. Why did this one learner do poorly on the assessment? Why did the entire cohort miss this question?
- Predictive—What will happen? Predictive analytics uses historical trends and patterns to predict individual learners’ success or failure. This allows instructors to identify learners early on who are most likely to fail or drop out.
- Prescriptive—What should I do? Prescriptive analytics aims to provide recommended interventions that the instructor—or the learner—can take to improve a learner’s chances of success
"A Gartner survey revealed that only 13% of companies use predictive analytics, and fewer than 3% use prescriptive analytics. Feedback loops between learners and instructors are woefully absent—but you can use learning analytics to change that."
Let’s explore the process of developing actionable learning analytics in an online environment.
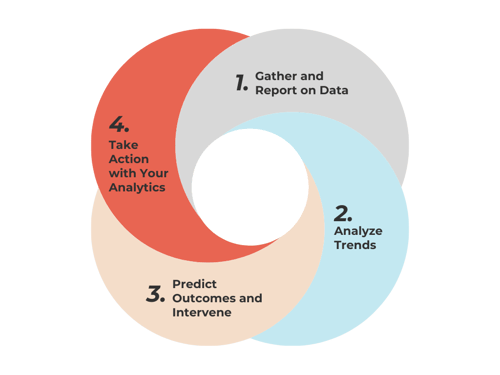
1. Gather and Report on Data
The first step in producing actionable outcomes from learning analytics is to gather the data you need and create reports. Reports can be generated in several different formats, but most people prefer to see data visualizations that make it easy to get a quick understanding of the learners that are likely to succeed. There are plenty of solutions and Moodle plug-ins that allow you to create visualizations that are easy to understand at a glance—a tremendous benefit, since you may be collecting a lot of data.
The data you collect should be a combination of engagement and performance data—but be sure you’re not collecting information that you won’t use.
Performance assessments should be frequent, and probably short, rather than high-stakes tests that are few and far between. Self-tests of just five questions may be all you and your learners need. By taking the pulse of your learners frequently, you’ll get a better picture of their learning success as they move through the online module. You’ll also be able to spot learners that are struggling early on, and intervene quickly before it’s too late to help them succeed.
2. Analyze Trends
Your data reports and visualizations will help you to identify historical trends and correlations, which you can use to understand what happened and why. Learning analytics software lets you compare a learner’s activity with others in the program, with learners who have previously taken the course, and against the module’s rubrics.
In this way, learning analytics capitalizes on the vast quantities of data that your LMS is already collecting to find patterns that can be used to improve learning.
3. Predict Outcomes and Intervene
Once you’ve analyzed trends in the data, the learning analytics software can create a model that predicts how each learner is likely to fare. Predictive analytics allows you to anticipate likely scenarios and develop an intervention strategy for each learner.
Intervention should be personalized to the learner—based on their engagement data, performance data and any personal information you may have. For example, if you notice that a learner stopped participating in online forums just before their performance began to drop, it would be proper to encourage the learner to resume their involvement in the forums. At the same time, it could be helpful to get feedback from the learner to find out why they stopped participating. There may have been an event in the course or some other obstacle that you should address in order to facilitate the learner’s involvement in the online forums.
Often, simple feedback is all that’s required for effective intervention. System-generated interventions can be anything from a simple dashboard alert about a learner’s risk of failure to assigning struggling learners specific actions to hone their skills. You can provide frequent performance updates, or send basic feedback messages to learners about their grasp of the material.
What’s most important in intervention is to make the intervention personalized and timely. Many LMSs provide tools to help make intervention as simple and trouble-free as possible. Much intervention can even be automated—for example, by providing learner dashboards that report up to-date performance indicators so that learners can self-regulate their own learning experiences and make necessary adjustments on their own. Effective intervention may involve adapting teaching styles. If your learners tend to do better with certain kinds of media, interactivity, or assessments, the course design should be adapted to enable better learning.
4. Take Action with Your Analytics
Learning analytics can be tremendously valuable to helping online learners become more successful and to assist struggling learners early on—but only if you close the loop and turn your learning analytics into actionable outcomes. Don’t just collect the data and produce reports— take learning analytics to the next level by creating actionable outcomes from learning analytics.
Next, we’ll explore a specific type of learning analytics that can be used to help reduce ineffective learning in your organization.
This video on How To Utilize Data To Improve Operational and Learning Effectiveness covers how combining your LMS, Analytics, and business data can result in some eye-opening benefits for your organization.
8. How Predictive Learning Analytics Reduces Ineffective Job Training
How much of your job training program is “scrap learning” (learning that is given but not applied back on the job)? One study revealed that about 20% of learners never apply their training to their job, and almost 67% of learners try to apply their training but revert to their previous habits. Another study found that 45% of training content is never applied. Scrap learning, or ineffective learning, can be costly to an organization’s bottom line.
For instructional designers—and anyone monitoring the ROI of your training program—that’s disturbing news. But if you know the possible causes of ineffective learning, you have a good chance of improving your numbers. Typical causes include:
- Content isn’t relevant to training goals
- No opportunity to apply new knowledge
- Learners aren’t in the right training
- Lack of managerial support
- Misalignment with goals and priorities
Predictive learning analytics can help you identify and mitigate these causes to make your online learning programs more effective at changing job behaviours. Predictive learning analytics takes learning analytics to the next level. Rather than simply understanding what already happened, predictive learning analytics lets you understand what is likely to happen. It predicts learners’ future success.
Predictive learning analytics relies on a collection of techniques that identify and measure patterns in learning data and extrapolate future behaviours—for example, not applying what they’ve learned—based on past trends.
Predictive learning analytics is different from other metrics because it focuses on the individual learner, rather than the learning program as a whole. This makes predictive learning analytics uniquely helpful in tackling the problem of ineffective learning. Predictive learning analytics allows you to determine who did and did not learn the material, and who is most (or least) likely to apply the things they learned to their jobs.
Take this entire guide with you! Download The Essential Guide to Learning Analytics in the Age of Big Data and keep it as your eLearning secret weapon!
How to Use Predictive Learning Analytics
Predictive learning analytics works best when it involves each of the stakeholders—learners, instructors, managers, and course administrators. Here are some practical ways your company can apply predictive learning analytics to decrease ineffective learning.
| Empower Learners | The simplest way of reducing ineffective learning is to warn your learners when they’re at risk. Dashboards like Purdue University’s Course Signals uses symbolic traffic lights as a feedback mechanism to let learners know how they’re doing—red for at-risk, green for on-track. Keeping learners in the know as they progress through online training allows them to make the adjustments they need in order to solidify their learning and develop positive habits that will carry over into their daily work tasks. |
| Warn Instructors | Instructor dashboards can identify trends to enable early intervention. For instance, some applications can notify instructors of at-risk learners and make recommendations for intervention. Other tools let you see how individual learners are performing, compared to other learners. You can monitor their status in terms of their predicted success and intervene as necessary. |
| Notify Supervisors | Supervisors may need to know if employees show signs of ineffective learning. You can use predictive learning analytics tools to send notifications to supervisors so that when learners apply their training to the job, supervisors can monitor their progress and watch for indicators that the learning isn’t being applied. |
| Develop Training Programs | Predictive learning analytics can also help drive organizational training policies by helping you to map out a training program for new hires and veteran employees. Using predictive learning analytics data, you can develop an online learning program that progressively trains new employees and provides refresher modules or advanced training as they continue their work at the company. |
Setting Up Predictive Learning Analytics
Successfully using Predictive Learning Analytics in your company requires thoughtful planning and preparation. You’ll need organizational support from executives and other stakeholders, and you’ll probably need to update your policies and procedures to accommodate predictive learning analytics-related changes. Also consider what skills and tools you’ll need to make the setup and long-term management successful.
There are many predictive learning analysis tools to choose from, and the ones you invest in will depend on the particular needs of your company. There are three basic approaches you can take:
- Create an in-house solution that’s tailored to your specific purposes for predictive learning analytics. Bear in mind that developing your own tool requires long-term commitment to maintenance, troubleshooting, and continual improvement. Be sure you’re able to invest the resources into this kind of project before you begin.
- Purchase an out-of-the-box solution. These tools are faster to implement than a custom solution, but costs can accumulate when you need to integrate with other applications. Customization is minimal, and security updates can be infrequent.
- Invest in a collaborative system. In some cases, several organizations work together to build a predictive learning analytics system, but usually, this is limited to academic institutions rather than corporate organizations.
Once you’ve implemented your predictive learning analytics solution, you’ll need a way to intervene. An intervention is any action that is designed to improve outcomes for a learner. An intervention can be passive or proactive, and can be automated or manual. In either case, it should have a specific goal and be measurable, so that you can evaluate its effectiveness.
Eliminate Ineffective Learning
Ineffective learning doesn’t have to pull down the ROI of your training programs. Predictive learning analytics can be a powerful and effective way to ensure that your learners successfully apply their training to their daily job tasks.
Now that we’ve put it all together, how do we practically improve online course design with learning analytics? We’ll address that next.
After 100’s of implementations our eLearning experts but together this manual covering the best practices and strategies for making data-driven decisions about your people in this eBook on Big Data for HR: How Predictive Analytics Can Deliver Business Value.
9. Improving Online Course Design
Learning management systems collect a wealth of data, and much of it goes untouched and unused. But you can take advantage of that data to improve the design of your online courses. Applying learning analytics can help your learners become more successful learners, and improve their effectiveness in their roles.
In this chapter, we’ll show you how learning analytics can help you improve your online course design. And we’ll give you some practical tips to get started.
Importance of Learner Engagement
Engaged learners are successful learners. Studies have shown a strong correlation between learner engagement with an LMS and their academic achievement. California State University, Chico, found that learners who spent more time on learning tasks within an LMS, and visited the home page more often, earned higher grades. Central Queensland University also found a correlation between the number of learner views on a course home page and their final grades.
The greater the engagement, the more learners learn.
In a face-to-face classroom setting, the signs of an engaged learner are obvious—eye contact, active note-taking, asking questions and volunteering answers. But in an online environment, it’s not as easy to measure a learner’s engagement.
However, learning analytics can help us understand learners’ engagement with online courses, and to identify where engagement is strongest and weakest. Finding strong and weak areas of engagement can help us understand what’s working and what aspects of the online course need some redesign.
Collecting and reading engagement data is not only possible in Moodle and other LMSs, but it’s also easy for course instructors to do. As you review the data, consider the following questions:
|
Online Course Design
Tips Online course technology is continually evolving, and so are the possibilities for improving your course design. If you’re starting from scratch, it can be overwhelming to figure out how to start applying learning analytics. Here are four ways you can use learning analytics to improve your online course design.
Adaptable Course Design
Design your online content into optional and manageable sizes. By “chunking” the content for consumption, you can measure their navigation through the content. Analyze how deep the learners are going into each resource by monitoring the time spent on each one. Questions to ask:
- Does the learner spend more time or less time as they progress through the course?
- Which resources are learners engaging with most?
- Which resources are learners engaging with least?
Learner Self-Regulation
Provide early feedback so learners can make corrections and improve their self-regulation. It’s incredibly valuable for learners to view feedback, in the form of assessments and instructor comments, throughout the course. When learners can gauge their performance as they progress through a module, they can make behavioural changes to become more successful learners. Yet, sufficient feedback has often been a weakness in the teaching-learning process for online courses. Using frequent and detailed feedback can overcome the gap.
Good feedback should:
- Help clarify what good performance is (goals, criteria, standards)
- Make self-assessment and reflection easier for learners
- Provide quality information to learners about their learning
- Encourage teacher and peer dialog
- Encourage positive motivational beliefs
- Provide opportunities to close the gap between current and desired performance
What kinds of feedback work best for online learning? There’s a wide variety of options to choose from—we recommend using several.
Some examples include:
- Automated tutors
- Peer feedback
- Auto-scoring assignments
- Reflective networks
- Written comments on an assignment
- Oral comments in discussion groups
- Self-checks
Auto-graded Quiz
Formative quizzes or summative assessments force learners to recall and apply knowledge in frequent low-stakes settings, rather than in one or two high-stakes like midterms/finals. Infrequent, high-stakes testing forces learners to cram and purge information, and doesn’t help them assimilate their knowledge. And when learners earn a poor grade, there is little if any opportunity to improve their performance—the final exam is final.
But frequent quizzing throughout the course enables learners to recall what they’ve just learned and communicate it effectively. This not only allows them to check their progress as they learn, but solidifies their learning as they rehearse the knowledge they’ve just acquired.
24/7 Grade Access
Simply making grade information accessible in real time can significantly help learners to learn better. Consider providing a progress bar that allows learners to see where they are—like a “You are here” pin on a map— throughout their exposure to the course. As their grade changes and as they complete more course requirements, the indicator can change to reflect their progress and achievement.
Learning analytics provides incredibly powerful information to help both instructors and learners achieve their goals. By observing learners’ engagement with the modules, and by providing feedback to learners, you can design more effective online courses that help increase learner achievement.
Take this entire guide with you! Download The Essential Guide to Learning Analytics in the Age of Big Data!
10. 7 Steps to Successfully Implementing Learning Analytics in Your Organization
To get the most out of your learning management system, you’ll need to implement learning analytics in your company. But that’s easier said than done. Organizations naturally resist change, and you should expect to encounter barriers to implementing learning analytics in your company.
But if you take a systematic approach, you can dramatically increase your chances of successfully implementing learning analytics. The Rapid Outcome Mapping Approach (ROMA) framework provides a helpful 7-step approach to implementing learning analytics that you can apply to your organization, no matter what your size, culture, or industry. ROMA is an evidence-based model for policy change. It can help you understand your organization, determine its resistance to change, and identify the resources and stakeholders that can help you succeed.
Ensure your learning analytics implementation is successful—follow these seven steps to implementing learning analytics in your company.
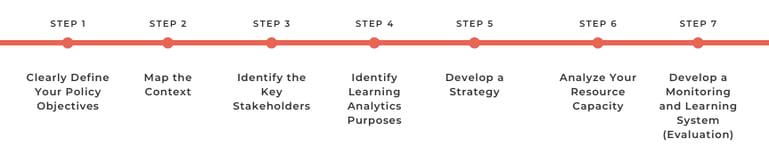
Step 1: Clearly Define Your Policy Objectives
The most important requirement to effectively making a policy change is to be able to clearly communicate the reason for it. Your objectives should support the overall goal of your company and align with your organization’s core values, mission, and culture.
Define very clearly your objectives for implementing learning analytics and the changes you want to achieve. Also consider the kinds of change you will need to implement. Some examples include:
- Communication patterns
- Procedures
- Documentation
- Attitudes and perceptions
- Behaviours and habits
While procedures, documents, and communication require thoughtful planning and significant time investment, attitudes and behaviours pose the greatest challenges, because these changes require your employees, themselves, to change. Expect some degree of resistance.
Step 2: Map the Context
Mapping the context of your project is critical, because it helps you identify the environmental, political, cultural, and other factors that will have an impact on the outcome of your implementation efforts. Understanding the context of your organization can help you anticipate barriers that you’ll need to overcome—as well as allies who can help you succeed.
Mapping the context involves examining the following things:
- The context—The people, institutions, and processes that may help or hinder change.
- The evidence—How can you convince skeptics of the need for change, and how should you present your case?
- Links—People and processes that give you access to influential connections. This is the set of existing networks you can use to help you implement learning analytics.
Download The Essential Guide to Learning Analytics in the Age of Big Data and keep it as your eLearning secret weapon!
Step 3: Identify the Key Stakeholders
Your key stakeholders are more than the people who are implementing learning analytics in your organization. They are the ones who will benefit the most from learning analytics. You should be able to identify multiple stakeholders.
Once you know who benefits the most from the use of learning analytics, consider which stakeholders hold the most influence. These could be specific individuals or a group of stakeholder, such as your department heads.
As you identify the top stakeholders, you should also start to gain clarity on your strategic planning and the approach to take to involve, inform, support, and train key personnel.

Step 4: Identify Learning Analytics Purposes
Successfully implementing learning analytics at your company depends on having a clear understanding of your purposes for learning analytics. Learning analytics can fulfill a broad range of purposes, and many won’t apply to your organization. However, you may have several valid purposes for using learning analytics in your company.
Examples of purposes for learning analytics include:
- Learner awareness
- Monitoring and tracking
- Research
- Evaluation and planning
- Reporting and communication
Think about which purposes apply to your organization, and which stakeholders they apply to—not all stakeholders have the same needs or goals. Consider which purposes and stakeholders are your highest priorities in order to guide your strategy.
Step 5: Develop a Strategy
A strategic plan helps ensure that your implementation happens predictably and in a controlled manner. Without a strategy, your implementation is much more likely to go off the rails.
Your strategic plan should identify everything that needs to be done in order to meet your goals. It should be informed by the previous steps you’ve taken up until this point and involve the stakeholders. Develop timelines, and review and update your strategy as needed.
Step 6: Analyze Your Resource Capacity
If you don’t have the resources, skills, or personnel to implement learning analytics in your company, you will find yourself in a long, uphill battle. Most organizations will need expertise in areas such as:
- Data science and qualitative analysis
- Project management and evaluation
- Database development
- Learning technologies administration
- IT support and interface development
- Analytics design and development
- Learning analytics reporting
- Institutional reporting and business intelligence

Step 7: Develop a Monitoring and Learning System (Evaluation)
As you implement learning analytics in your organization, continually monitor your progress and make adjustments as necessary. Continual evaluation not only helps you understand your current initiative, but it gives you valuable insight for the future as well.
In this step, revisit your first principles—the original policy objectives and vision—to ensure that they are still relevant and that you’re continuing to head in the right direction. At the end of implementation, conduct a review of the overall process and make notes for future efforts.
11. Ethical Implications of Learning Analytics
Learning analytics provides tremendous opportunities to assist learners— but it also poses ethical questions you shouldn’t ignore.
Many companies are using learning analytics to track and understand learners’ behaviours, but they aren’t considering the ethical implications that it raises. The amount of personal data that’s available through your LMS is unprecedented, and online learning experts are still wading through all of the issues involved in handling and managing the data.
As a result, there are no established ethical standards that companies are required to follow—which means each organization must carefully consider how they will use learners’ personal information, who will have access, and what will be communicated to learners.
Businesses have always collected information about employees, so why should this be any different? Traditionally, employee data has included address, pay rate, and basic demographics. But the details that LMS learning analytics makes available is on another level:
- Data comes from different sources and different locations
- Every button click is captured
- Learning analytics uses automated analysis and predictive scoring
The issues that learning analytics opens up are new and multifaceted. If you’re using online learning at your company and capturing learner data, you need to be certain that the information is handled ethically.

Ethical Concerns with Learning Analytics
The practical challenge of learning analytics is the question of privacy of the learner. Questions abound:
|
Let’s explore each of these questions briefly.
Data Access
Who has access to the data that’s collected? Should administrators or course designers have the same access that instructors have? Should instructors have access to all of the data, or just some of it?
If your learners are geographically scattered, it might be helpful to know what city they live in—but that doesn’t mean instructors should know learners’ street addresses. Other sensitive information should probably be off-limits as well: credit cards (if courses are paid for), SSN, passwords, etc.
Transparency
How much should you disclose to learners about the information that’s collected, and how it will be used? Most learners realize that some amount of their information is being collected, monitored, and analyzed. It’s a ubiquitous online experience in today’s internet culture. But chances are, your learners aren’t aware how much you’re using their data—especially in an educational or training setting.
Consent
What kind of consent should you ask learners to give? Can you use some (or all) of their data without consent? Should you allow learners to be anonymous online? There’s general consensus that you’re ethically obligated to get some kind of learner sign-off, but there isn’t an agreed-upon standard of what the sign-off should include.
Location and Security
Where should learner data be stored? Most organizations don’t control the storage, location, or security of the data that’s collected. Often, data is housed not just outside of the institution, but outside of the country. Certain security and privacy laws may not apply in the country where the data is located—which means your learners’ data could potentially be used or sold without their permission.
Data Ownership
Who has the right to determine how the data is used? Can personal information or learners’ online activities be used for unrelated purposes, such as research or marketing? Can learners control how their data is used? How long should the data be kept before it’s deleted?
Misinterpretation
Learning analytics often relies heavily on interpreting data and connecting the dots. That means instructors need to rely on intuition and assumptions at times. It’s entirely possible to misinterpret the data or see patterns that aren’t really there. What are the implications for responsibility and liability in the case of misinterpretation, or inaccurate information?
Obligation to Act
Some learning experts believe that we are ethically obligated to act once we have information. But it could be argued that not every piece of action requires action. What data obligates action, and what data doesn’t? Do we really have a responsibility to act on data?
Any organization that collects learner data for learning analytics must address these questions. The implications can be dizzying for many companies, but you don’t have to feel your way through the issues on your own. Here are some helpful guidelines for developing an ethical approach to learning analytics.
Take this entire guide with you! Download The Essential Guide to Learning Analytics in the Age of Big Data and keep it as your eLearning secret weapon!
How to Protect Learners’ Privacy
What steps need to be taken to protect learners? Follow these guidelines as a starting point for your company’s code of practice for learning analytics.
|
1. Define the Scope and Purpose You must have a defined understanding of what data will be collected, how it will be used, and for what purpose. By establishing the scope and purpose of your learning analytics, you set ethical boundaries that you can explain and defend when learners have questions about how their information is used. |
|
2. Be Transparent and Get Consent Provide learners with documentation that clearly describes the processes involved in data collection and analysis. Explain how the data will be used, and why—and how it won’t be used. Get consent from each learner before any data is collected. However, there may be legal circumstances where learners aren’t permitted to opt out—if so, be clear about these scenarios. |
|
3. Protect Privacy Restrict access to learner data. Not everyone who has access needs complete access—only give staff and administrators the kind of permissions that they need to have. Whenever possible, make learner data anonymous. Also be sure that learner information is protected when contracting with third parties for data storage and analysis. |
|
4. Enable Positive Interventions You’re collecting data for a reason—to help learners succeed. Establish clear guidelines that delineate how and when instructors should intervene to help struggling learners. Specify the type and nature of interventions, and who should carry them out. Also, communicate the learners’ responsibilities for self-intervention when feedback data is presented to them. |
Are You Ethically Prepared?
Learning analytics can open up a Pandora’s box of ethical issues that you’ll need to be prepared for. And while there’s still much discussion in the online learning industry about what exactly your ethical obligations are, you can establish a basic code of practice that protects both your company and your learners from abuse of information.
The advent of big data has given instructional designers an opportunity that was never possible before—the opportunity to use learners’ behaviours as a way to improve the learning experience. Learning analytics can help your company achieve new levels of training effectiveness and operational efficiency.
Now that you understand what learning analytics is and how to implement it in your company, take the next step: Discover what an award-winning cloud-based Learning Analytics solution looks like (and the incredible benefits it can bring not just to your eLearning - but to your entire organization) with Lambda Analytics “Zoola”: check out the video Ask Me Anything (about) Zoola Analytics or get your learning analytics questions answered Live.
Take this entire guide with you! Download The Essential Guide to Learning Analytics in the Age of Big Data and keep it as your eLearning secret weapon!
Any questions? Get in touch with us!

12. Additional How-to Resources
Ready to keep climbing down the Learning Analytics rabbit hole? Here’s what we’ve got for you:
- eBook: LMS 101: Learning Analytics
- eBook: The Practical Guide to Evaluating Your Workplace Learning Effectiveness
- Webinar: How To Utilize Data To Improve Operational and Learning Effectiveness
- Webinar: Top 5 Tips for Keeping Reporting Simple
- Article: What Are The Most Important KPIs for LMS eLearning?
- Article: The Most Beneficial metrics for eLearning and Why You Should Track Them
- Article: Healthcare Analytics: Why Educators Are Using Blended Learning and Big Data in Healthcare
- Article: Learning Analytics: The Art and Science of Using Data in eLearning
- Article: Analytics Reporting: How to tell if your quizzes are passing the grade
