


Learner data and analytics reporting are today’s most powerful eLearning tools, and they’re never more powerful than when in the hands of a capable L&D team. In this post, learn how capturing data and producing analytics reports can inform the way you select teaching strategy, assess courses, and design future corporate training.
Why should organizations be using data analytics?
Interestingly, the rise in data-led course design over the past decade or so has coincided with a fall in the amount of resources organizations are spending on their corporate training programs.
From 1979 to 1995, for example, the average time allocated to training fell from 2.5 weeks to 11 hours, while as many as four out of five of today’s employees are not receiving on-the-job training.
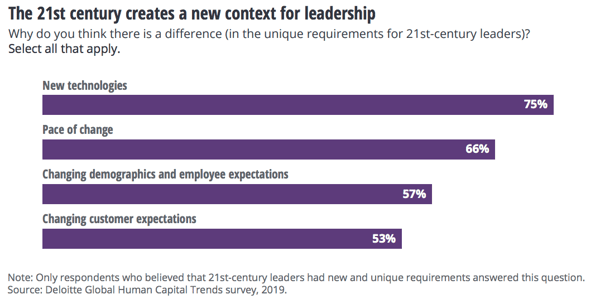 Deloitte survey on the unique challenges faced by 21st-century leaders (source: 2019 Deloitte Global Human Capital Trends report).
The evidence clearly indicates that most organizations are reluctant to agree on large training budgets. Unfortunately, the need for substantial training resources is growing at a rapid rate. With new technologies and workplace expectations changing the dynamic of 21st-century business, it’s simply unrealistic to expect employees to adjust and acclimatize without internal support.
Today’s millennial graduates and new hires are skilled multitaskers and intuitive learners, but they’re also accustomed to an ever-changing job market. Because of this, they are also more likely to be new to the company, their role, or even the industry.
So how do you provide for growing corporate training needs in an L&D climate of reduced hours and restricted budgets?
Using data analytics to inform eLearning course design gives clear, quantitative evidence on what content learners want, what teaching approaches they respond best to, and (most importantly from a budget perspective) what training materials are not performing and can therefore be cut.
The result is a more optimized, ROI-boosting training program, which produces the same or better learning outcomes for less. For a detailed example of how organizations use data analytics, read our case study on how Toyota Reduces Costs and Improves Training Effectiveness with Automated Reporting Solutions.
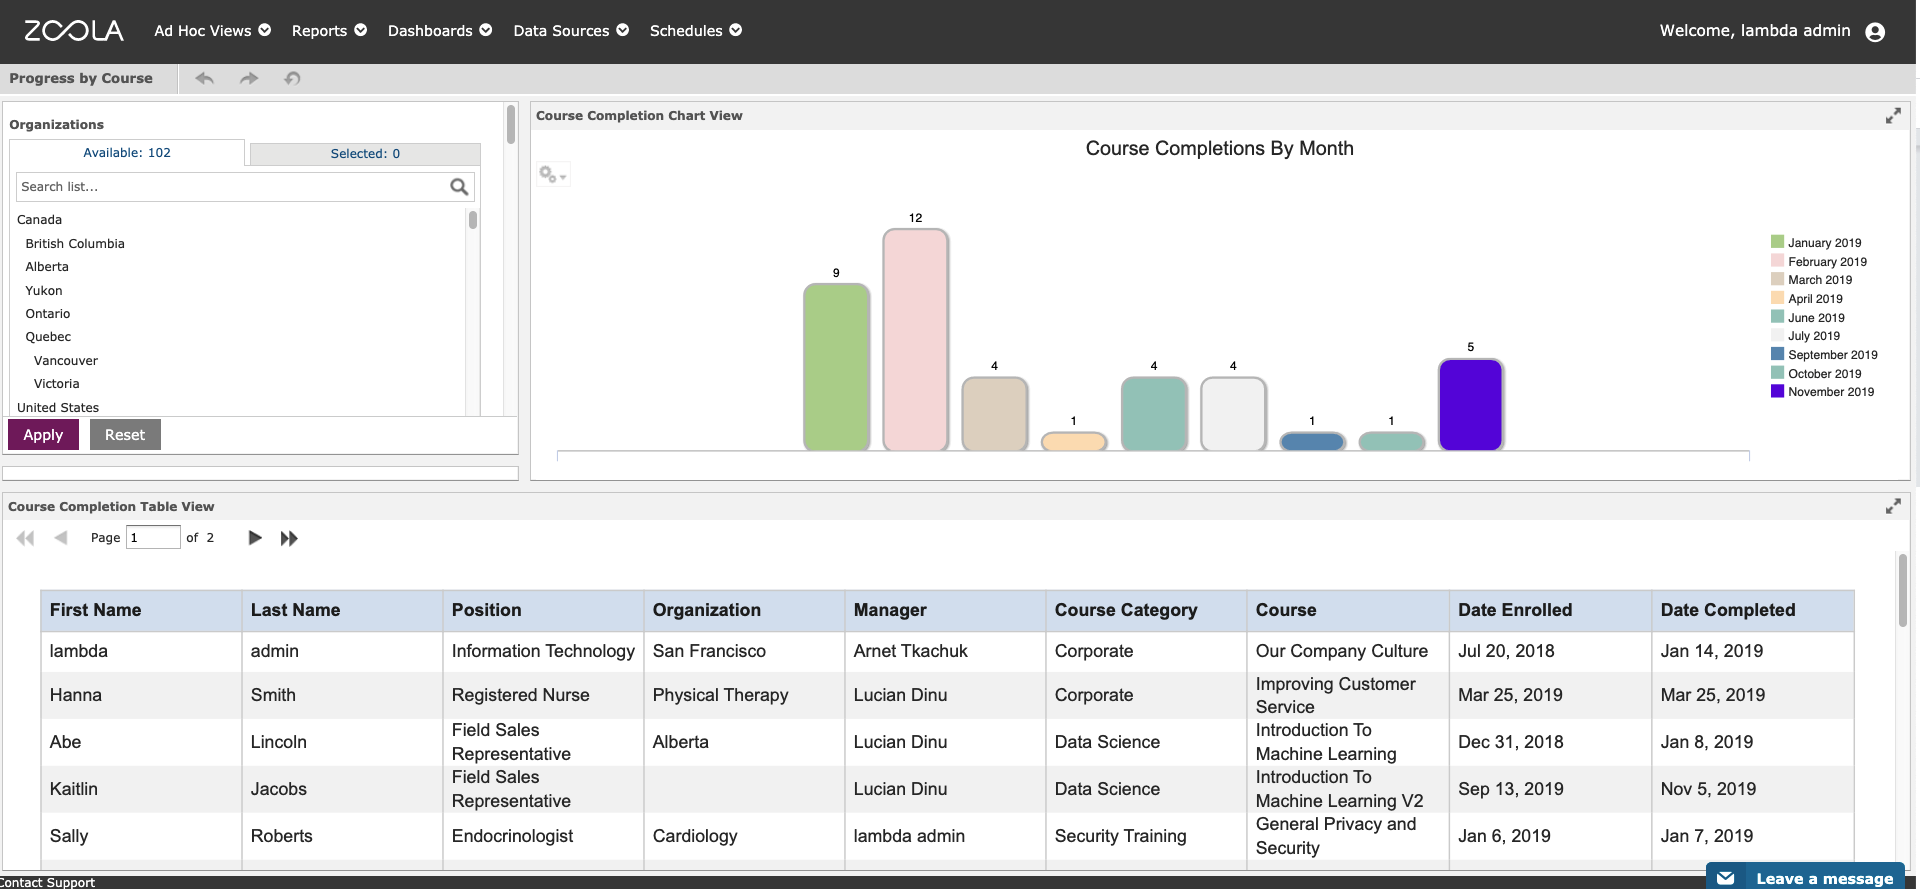 A ‘progress by course’ dashboard in Zoola Analytics (aka Lambda Analytics). Learn more about reporting on course completion with Zoola Report Focus: Progress by Course Dashboard.
What exactly are organizations talking about when they say ‘data analytics’?
1. Reports
On a day-to-day basis, L&D teams interact with data analytics through a reporting tool, such as Lambda Analytics.
Reports are visual and statistical representations of all the goings-on within your Learning Management System (LMS). They shed light on exactly how learners are interacting with eLearning courses—for example, the time spent learning, where learners most focus their attention, or which courses are being fully completed.
This makes reports a great way to give educators, designers, HR, and wider stakeholders insights into the reality of what training really means inside your organization.
If you’re responsible for creating or refining a training program, in an LMS like Totara Learn, analytics dashboards can function as an Ad Hoc tool to explore the workings of your program and begin building a strategy for design updates.
By experimenting with how data is categorized, filtered, or visually represented, it’s possible to form a narrative about the user experience, and a persuasive case for future course design.
2. Key Performance Indicators (KPIs)
In building such a narrative, most L&D professionals are looking for Key Performance Indicators, as a way of tracking course design and expenditure against performance and learning results.
For instance, you might be interested in whether learning data supports changes to your enrollment process, or a switch in marketing strategy. To find those KPIs, course designers will use reporting software’s interactive filters to refine their information, before running a report. For aggregated data, reports can also be scheduled to run and export at prearranged intervals.
3. What reports come out-of-the-box with Lambda Analytics "Zoola"?
Here’s a few examples of Lambda Analytics reports, which work with both Moodle and Totara Learn LMS.
(To find, run, copy, and edit Reports in Lambda Analytics, open the Repository and navigate to Public > Moodle/Totara > Reports.)
|
Enrollment: who hasn’t yet enrolled? |
This report tells admins and instructors who has not enrolled in courses within the LMS. The report can be filtered by course, categories, assignment, and dates so that admins can pinpoint individuals or whole teams. |
|
Feedback summary |
A feedback summary listing every feedback module, question and learner response. This report can be filtered by category, course, module, and completion date, allowing admins to see the big picture in terms of user satisfaction. Alternatively, a course-only view lets instructors develop a better understanding of their courses. |
|
Progress: Activity completion pie chart |
Pie charts are great for immediate visual knowledge. This report drills down on activity completion, giving a status breakdown on users and courses. Works perfectly for instructor dashboards. |
|
Quiz statistics |
This report gives information on all quizzes, including attempts, completions, grades and time-taken to complete. It can also be filtered by course so that admins see all data, while instructors only see information on their courses. |
|
Progress: Program completion breakdown |
Program completion breakdown is a transcript-style report that gives information on courses and activity completion in printable format. It includes data on users, program, course, activity, and completion, and can be filtered by user, manager and date. |
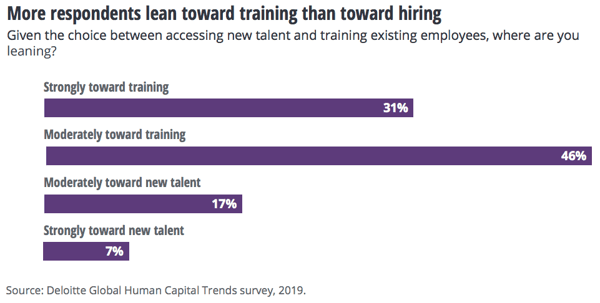 (Source: 2019 Deloitte Global Human Capital Trends report.)
How can my team design corporate Training Courses using Data Analytics?
As the above visual shows, the vast majority of organizations believe in the upscaling power of internal training programs. So when it comes to using data analytics to boost training, there are a few recommended ways to harness all that data...
1. Designing course content
For designing brand new course content, you can use KPIs and data on employee performance history as the foundation of your design process. Starting from a perspective informed by how learners are actually using your LMS should allow you to tailor content for maximum appeal.
For example, you might find a correlation in previous content between engagement and interactive assessments. This would suggest interactivity should be a consideration when building your new content. Luckily, the latest version of Moodle LMS includes new ways to encourage learners to interact with their training.
The introduction of HP5 content makes it easier than ever to create interactive assessments and quizzes. Try this short presentation on building interactive content with H5P, along with other Top 5 Practical Applications for Building Engaging Learning.
2. Adapting training courses to learners over time
Pre-existing content can be optimized by using data to reveal learner strengths and preferences. While one group of learners may excel in group assignments, for example, another might prefer written work. Knowing where these trends lie makes it possible to adjust your training accordingly.
There are a number of course design approaches that promote this level of content flexibility. Adaptive learning courses are designed to offer tailored content depending on user behaviour. Adaptive software will observe how learners are performing, and make a live decision about how the course should appear to an individual student.
For example, if an adaptive program observes a learner struggling with a particular set of questions, it might lower the difficulty of future assessments, or provide additional resources, depending on the program’s configuration.
Lesson activity data can be used to build these branching content pathways. For more on how to achieve this, see Analyzing lesson activity data to build better eLearning.
Microlearning is another flexible, interactive course format that allows users to choose content that appeals to their strengths. Microlearning involves delivering individual training concepts in fast, easily digestible portions.
To maximize reach, L&D teams can create universal microlearning content that works as an introduction for all employees, before filtering down to more specific content, further along the learning pathway.
Here are some other ideas for How To Utilize Data To Improve Operational and Learning Effectiveness.
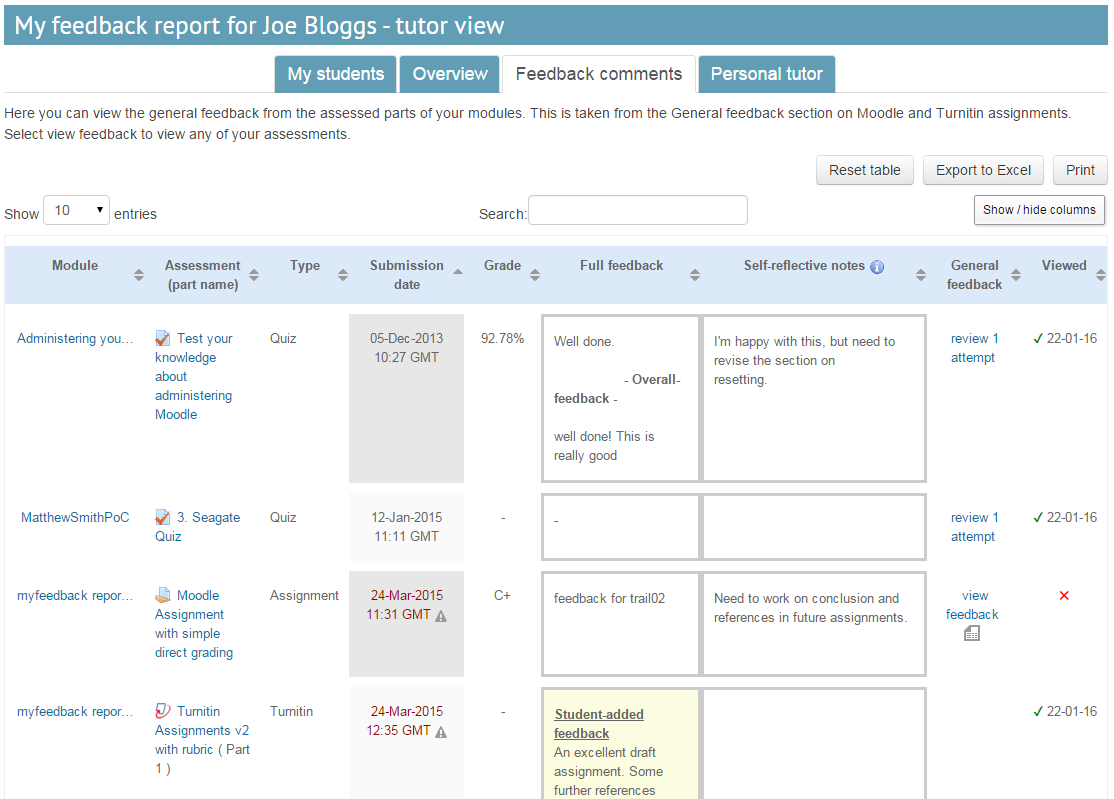 An example of a Moodle plugin for collecting and presenting user feedback (Source: My Feedback).
3. Course assessment
Collecting learner feedback is essential as a way to contextualize your data and understand trends at a greater depth. Comparing what learners say about a course, to how they actually perform, may reveal areas where L&D teams can update content and improve outcomes.
A good way to collect qualitative learner feedback outside an LMS is through the marketing and communications you use to interact with learners. Adding a feedback form to newsletters sent to a subscriber base is an efficient way to get the word out.
With an LMS integration such as Lambda Suite, you can even automate emails so that feedback is being collected at regular installments.
Alternatively, you might want to add a feedback page or module at the end of a course, where users can leave their thoughts and reactions, immediately after finishing a session.
Data-led training is the future of efficient, cost-effective course design. If your organization is struggling to use data effectively, try this Ask Me Anything (about) Zoola Analytics (aka Lambda Analytics). Lambda Solutions VP of Products, Stewart Rogers, answers the most pressing questions on using analytics for LMS reporting.
Still looking for an answer to your data analytics question? Contact Lambda’s eLearning experts.

Keen to keep climbing down the Learning Analytics rabbit hole? Here’s what we’ve got for you:
- eBook: LMS 101: Learning Analytics
- eBook: The Practical Guide to Evaluating Your Workplace Learning Effectiveness
- Webinar: How To Utilize Data To Improve Operational and Learning Effectiveness
- Webinar: Top 5 Tips for Keeping Reporting Simple
- Article: What Are The Most Important KPIs for LMS eLearning?
- Article: The Most Beneficial metrics for eLearning and Why You Should Track Them
- Article: Healthcare Analytics: Why Educators Are Using Blended Learning and Big Data in Healthcare
- Article: Learning Analytics: The Art and Science of Using Data in eLearning