


Whether you are using Moodle or Totara Learn as your LMS, you are probably interested in seeing patterns of course completion over time. Our Progress by Course Dashboard provides an excellent overview of completions by month, and can be used to drill down to show learner details based on the filters you’ve chosen.
This is a great dashboard to highlight the power of interactivity using filters. With the Progress by Course dashboard, you can slice and dice the data by:
- Course Category
- Course
- Date Completed
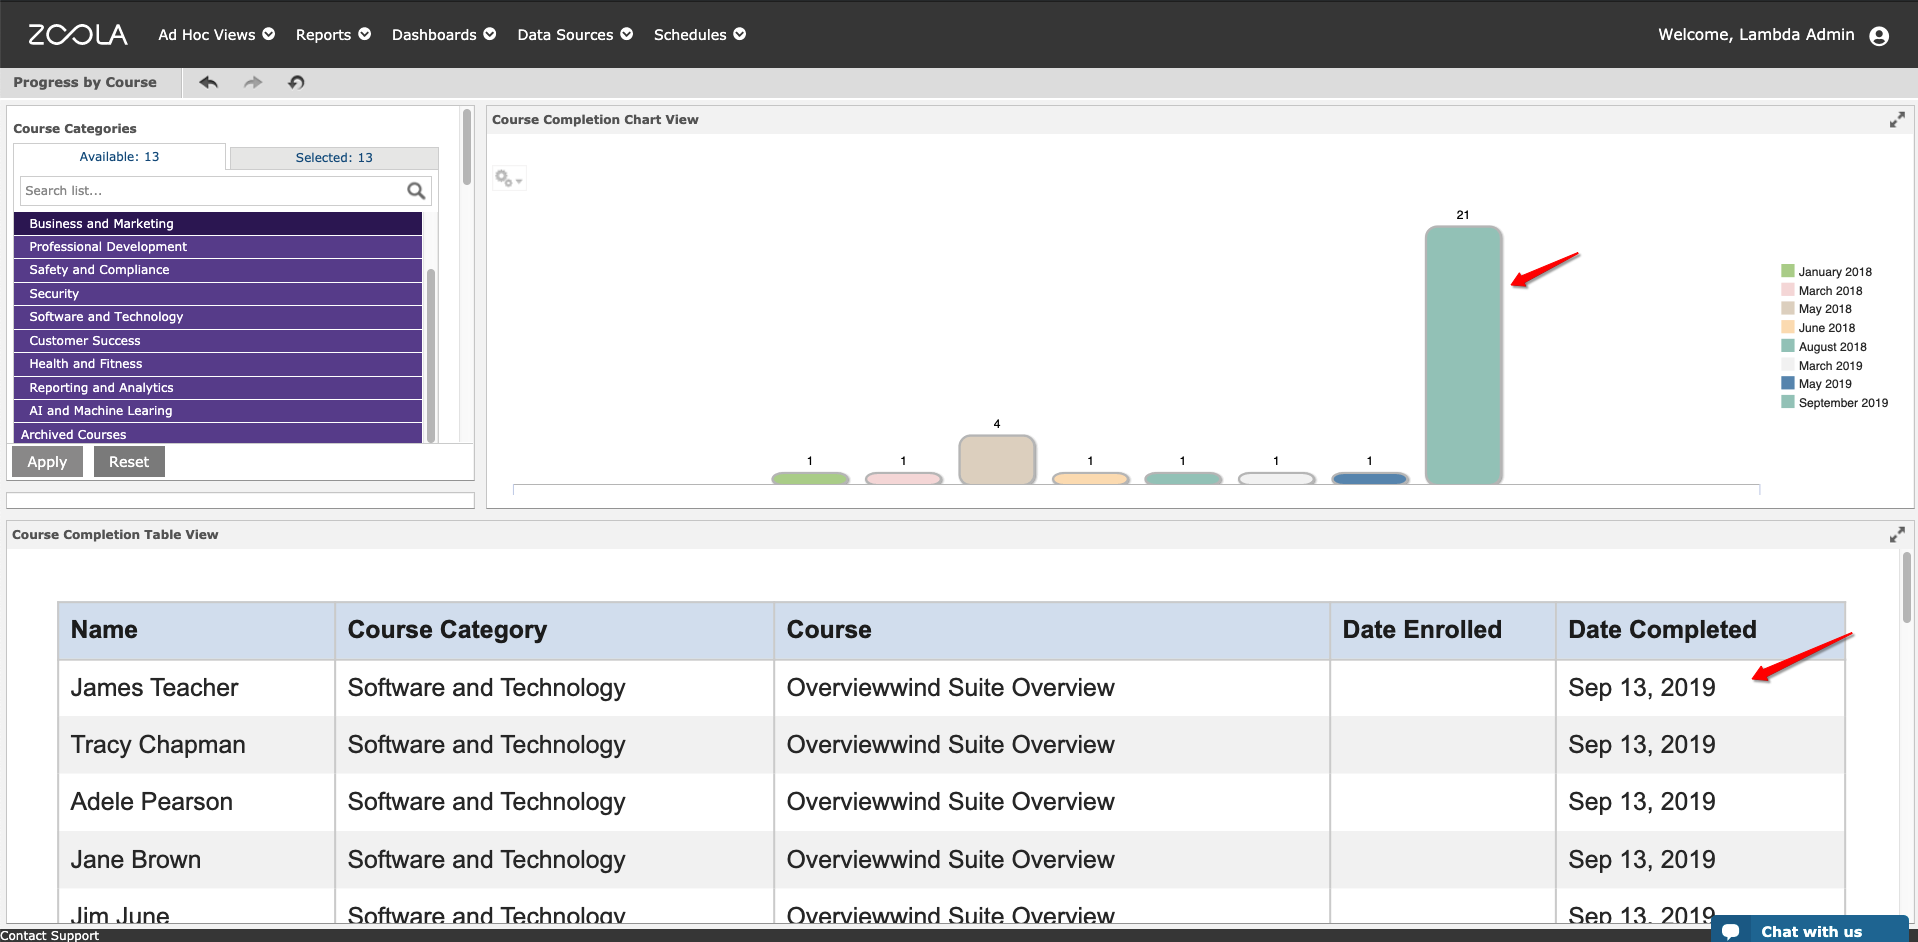
Then you can also use the Course Completion Chart view to filter the table report by month.
Here, I’m looking at the past 12 months across all data in the site, then used the chart to filter the table by September 2019, as there is clearly a spike in completions that month.
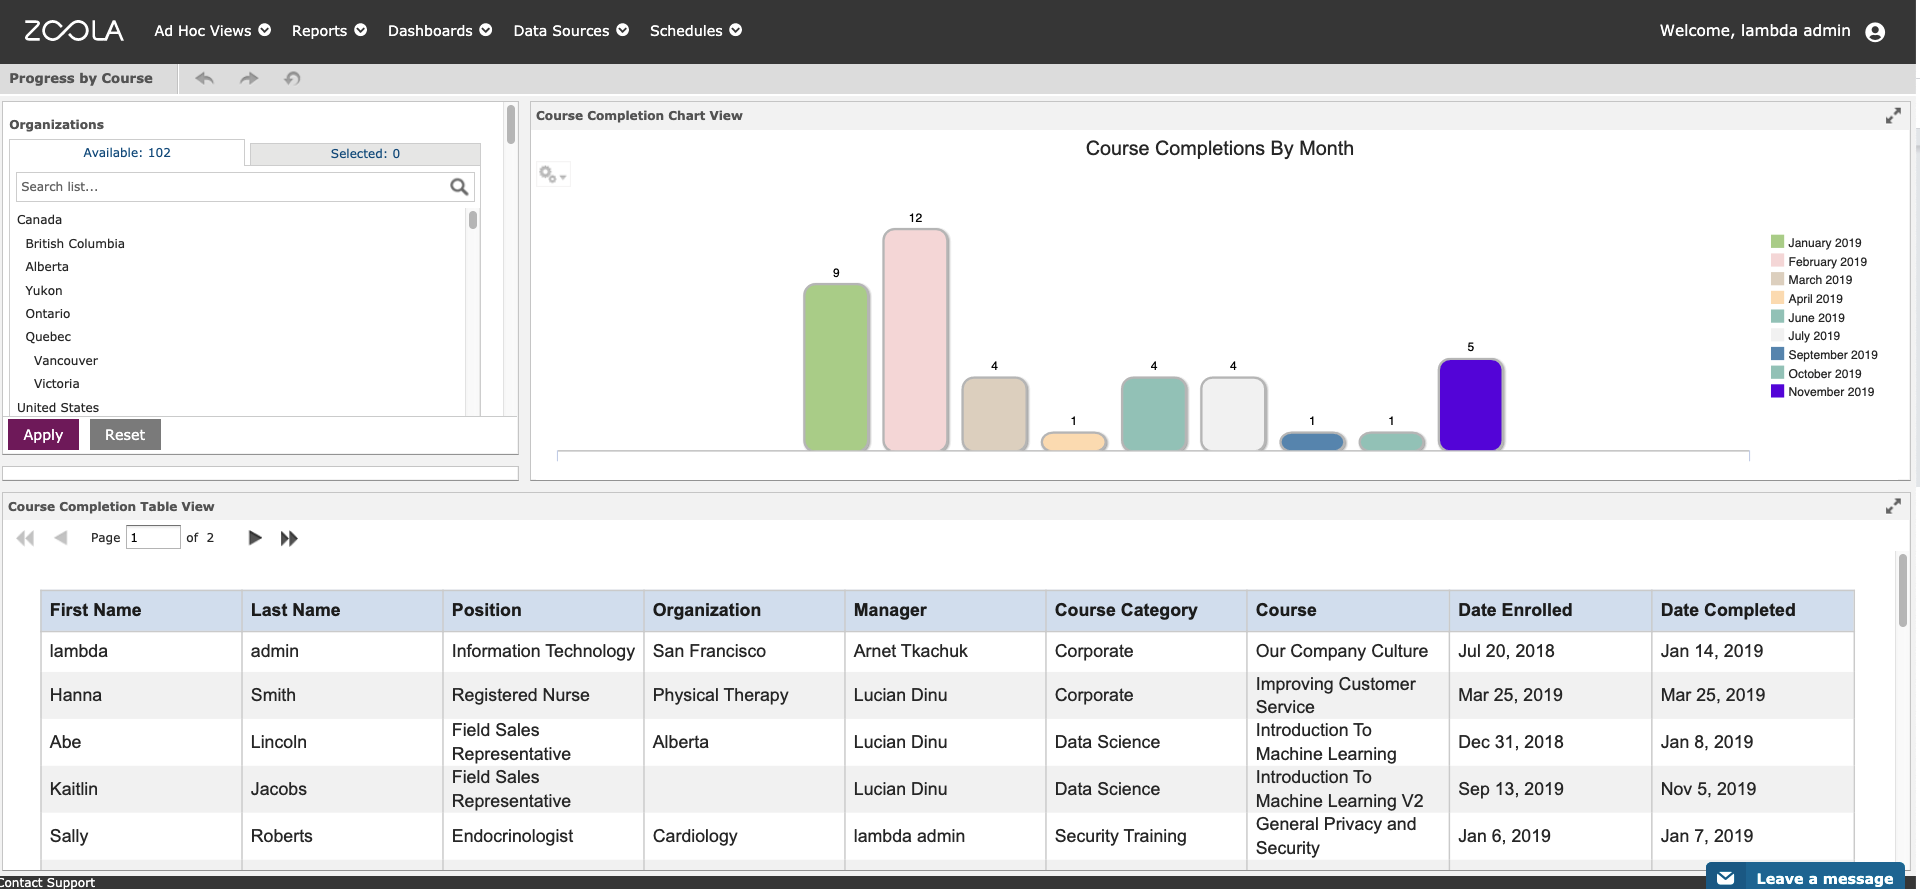
If you are using Totara Learn, you will see a similar dashboard, with a few more filtering options, such as:
- Organizations
- Positions
- Managers
Zoola Dashboards work really well on your LMS Dashboard! Just click “Run” in the Zoola Reports block to see your dashboard when you log in.