


One of the most common metrics of success for online learning is number of enrolments in courses. To provide stakeholders a pulse on enrolments in your LMS, you can share the Course Enrollment Chart.
Out-of-the-box, this report can be filtered for course categories, course name, and/or by date. This means that you can take a look at enrolments across the LMS or narrow your view to a specific course.
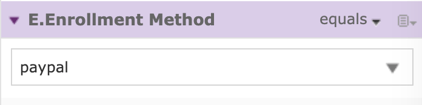
Since this report resides in the Ad Hoc View repository, you can easily add, change or modify the filters to suit your needs prior to saving it as a Report. For example, many clients have multiple ways to enrol users into a course and therefore you could add a filter for Enrollment Method to show how many users enrolled by PayPal vs how many users were enrolled manually.
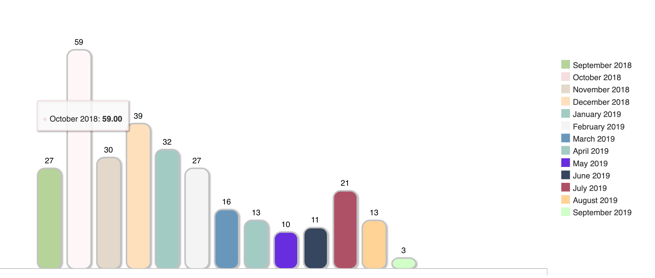
When viewing the report, you can hover over the columns to see more specific information, as below, I’ve hovered over the second to the left column to show the month (also seen on the right side legend).
You may also want to check out the Course Completion Chart View, and the Time Spent Learning Chart View.
