%20(Website)-1.png?width=958&height=325&name=LAMBDA%20LEARNING%20LOGO%201(%20px)%20(Website)-1.png)


Every picture tells a story. As busy, visual beings, we want information, quickly. And we don’t want to have to work at understanding it. Don’t make us think, just give it to us on a silver platter.
Learning management systems (LMS) house mountains of learning data. Making sense of it all can be daunting. In fact, with only 4,000 learners, an LMS can easily generate over 6 million records!
Dashboards can be used as a powerful way to present data-based intelligence using visualization techniques that display relevant, actionable data. They can track stats and key performance indicators (KPIs) and present this data in a quick, easy-to-scan format, with the most relevant information understandable at a glance.
Having the right approach to data visualization is a key feature in laying the foundation of a successful dashboard. Data visualization is the presentation of data via graphics and pictures—its primary objective is to help decision makers identify patterns or understand difficult concepts that may go undetected in text-based applications.
What is a Dashboard?
A dashboard is a summary or presentation of various data sets (text, images or other media). Using dashboards can help you connect information that leads to analytics and make better decisions.
3 Elements of a Good Dashboard
An effective dashboard contains 3 elements, namely:
- 1. Know Your Audience: determines which content and the level of details to include in the dashboard
- 2. Tell A Story: presents your findings in an intuitive way and illustrates the findings that support your statements
- 3. Leads to Action: makes connections and answers questions
Element #1: Know Your Audience
When determining audience and their needs, specific questions can be asked to really get to know exactly who your audience is to customize reports for each one. This follows Bloom’s taxonomy methodology and applying high level thinking skills.
Who is your dashboard audience?
- Project Managers, C-Suite, Strategy Planners, Administrators, Trainers, Learners
What do they need?
- Detail, Trends, Data from External sources
What are they trying to do? (know, analyze, evaluate)
- Knowledge: how many users in the site?
- Analysis: these users do this, this course is popular
- Evaluation: can you prove that these courses led to better grades? Was your new content more effective? What data leads to this conclusion?
Element #2: Tell A Story
When you want to tell a story with dashboards or data, the findings should be presented in intuitive ways so that the viewer gets a complete understanding of what they are seeing. This can also be reflected in the charts and tables you choose. If choosing charts with colour, you may want to consider highlighting the points that are most relevant to your goal or question. Additionally, you should be able to connect other reports or data in the dashboard together using a common theme, such as colour, or chart type.
Including instructions on how to use it, or what the data might mean, is a good way to support your audience who needs to use the information to make meaningful decisions.
What story are you trying to tell with your Dashboard?
- Enrollment to Completion
- Time Spent to Grade Received
- Identifying Students at Risk
- Recertification and Compliance
- Effectiveness of new Learning
What are you going to do with this data?
- Get more funding
- Hire more trainers or support team members
- Improve learning materials
- Support lagging students
Dashboard Example #1: Project Managers
“I want to see the effectiveness of our LMS project.”
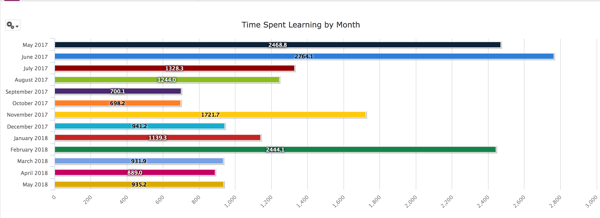
Project managers typically want to evaluate trends and charts that compare completions or enrollments over time, or relationships between time spent and grades. They are not usually too curious about the specifics of individual users but rather may want to see the details for courses with the highest grade average or with the most completions. A number of factors can be examined to determine LMS project effectiveness, including:
- Number of logins
- Number of enrollments
- Time spent
- Average grades
Dashboard Example #2: Administrators
“I want to see the effectiveness of our courses”
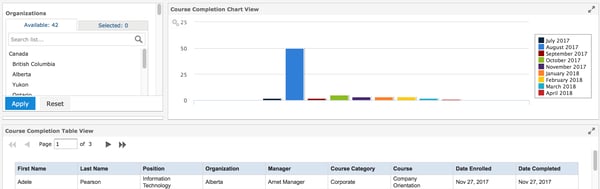
Administrators want to analyze which courses have the most enrollments and who was enrolled in them. For example, how much time did it take for a user to login after signing up for a course, or to finish their course? Effectiveness of the courses can be determined by examining the following:
- Number of users and completions
- Time spent and grade
- Who received which grade
Dashboard Example #3: End-Users
“I want to see my courses, my grades or my activities.”
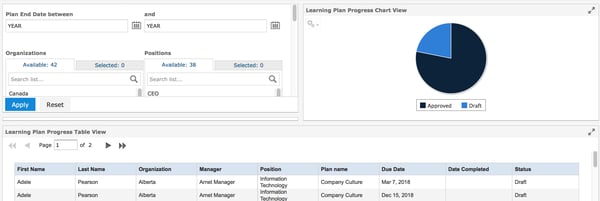
End users can include both instructors and learners. They want to know who is in the course, who has completed a certain activity, what is outstanding, and what are the grades, time spent or number of logins to the course. Details are important to this group, with an image being useful if it shows the relationship between completion and in progress. A number of reports and dashboards can be presented for end-users such as:
- Enrolled courses
- Grade in course
- Progress in course
- Activity Completions
Dashboard Example #4: Custom Dashboard in Zoola Analytics
Identifying students at risk is key to being able to then ask questions as to why the learner is falling off. This information can be used to further investigate what is happening with the learner, or if the course needs to be adjusted to improve program effectiveness. There are a number of factors determining at risk learners and a key component of this is the engagement factor. Are learners engaged with the course material?
- Custom Dashboard - Students at Risk
- Can be done with existing Zoola Dashboards
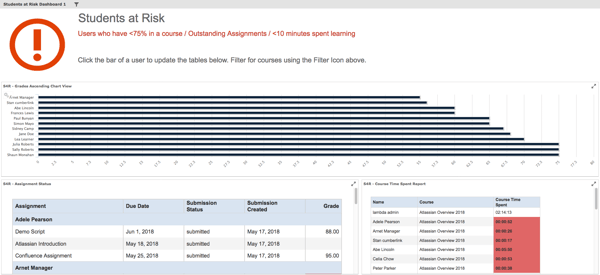
The above screenshot depicts an example of a "Students at Risk" dashboard. Depending on your organization, At Risk factors will vary depending on how you define them for your organization and audience.
Our example above users in a specific course (Atlassian Overview 2018), and users with course grades less than 75%, those who have failed assignments and users with less than 10 minutes spent learning. This data can be used to identify an action plan for users at risk.
Element #3: Leads to Action
How Does Zoola Analytics Tell a Story That Leads to Action?
Zoola Analytics supports story-telling elements by allowing reports to be resized on a dashboard so that their proportion can indicate importance. Additionally, the colours can be configured for the background, title bars, text, and more within the dashboard, to give it that personalized or branded feel.
Letting the data do the talking is part of good story-telling, and the viewer should also be able to connect the various components of the dashboard together to show the different parts of the whole. This is where the analytics comes in that enables you to illustrate several reports that are built that can be tied together. The end result of a good dashboard leads to action being taken and improvements made.
Need Help with Engaging Learners?
Watch our on-demand webinar, Using Analytics to Deliver Engaging Courses, and start analyzing course engagement data in your LMS so you can identify and prioritize changes to your learning programs:

Read our eBook, Getting Engaged: How To Make Your Learners Fall in Love with Learning, to explore different strategies and tools to boost engagement: